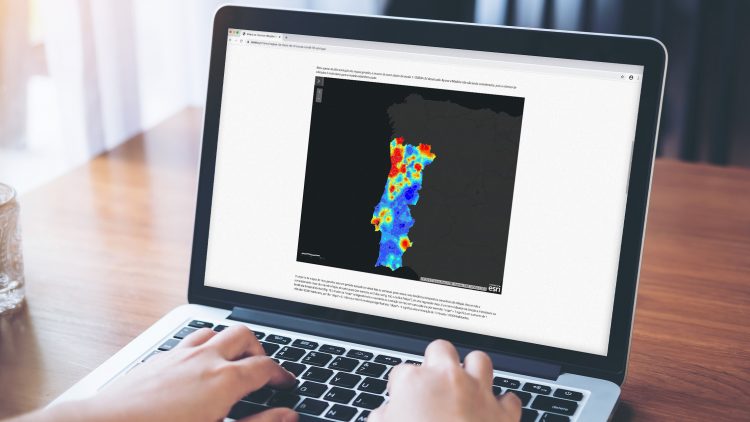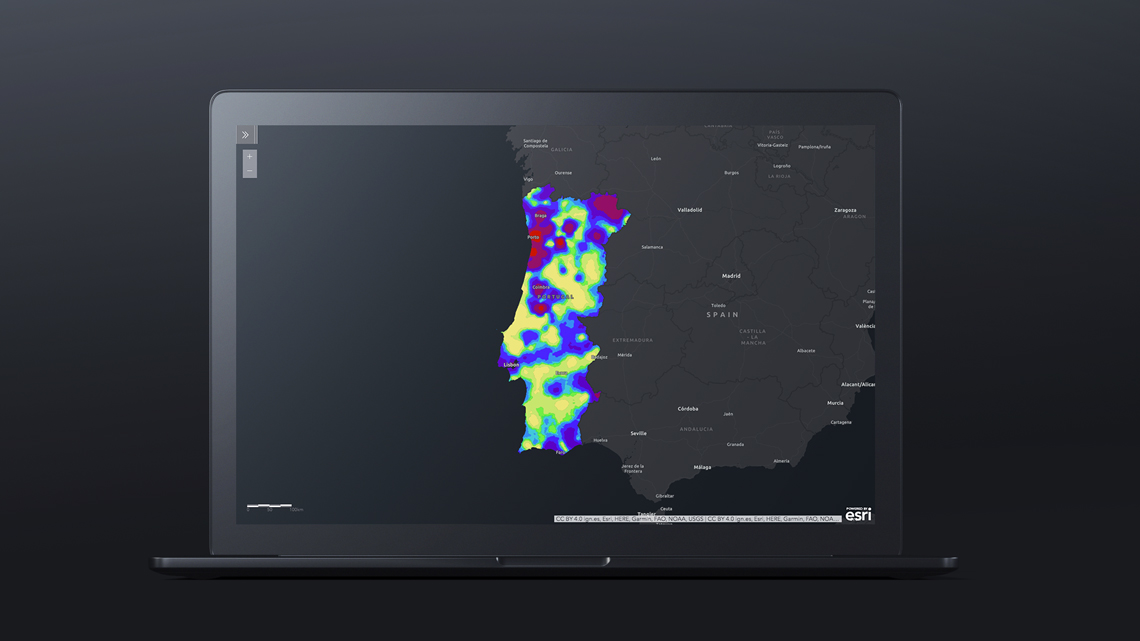
CERENA recently developed a tool that provides COVID-19 infection risk maps for mainland Portugal. The method is based on the number of new daily infection cases data per municipality as provided by the Portuguese Health Department (DGS), as well as the uncertainty attached to the risk.
“The model is able to reflect the uncertainty resulting from sampling errors and according to the dimension of each municipality population”, explains Maria João Pereira, Técnico professor and CERENA researcher. “Our models also have the advantage of disaggregating data, that is, the phenomena of contamination ‘ignore’ the limit of municipalities, which allows us to see the phenomenon in space continuously. This way, we can better identify the risks in their spatial dimension”, explains the CERENA researcher. “In fact, we are recording the ‘spatial’ history of the pandemic in Portugal”, highlights the Técnico professor.
The risk maps can be used by public health officials to identify local risk areas and to guide surveillance and control activities. “These maps allow us to identify the dynamics of infection and help us to better manage preventive and contingency measures”, says professor Maria João Pereira. In addition, these maps also allow us to monitor the effect of these measures. The CERENA team believes that the results from these maps can be used in the next phase of the pandemic in Portugal. “After covid-19 peak hits our country and when we start making decisions about how to get back to normal, the information provided by these maps can help decision makers in the various stages”, highlights the CERENA researcher. “On the other hand, now that we are going to start monitoring immunity, these maps can be useful to plan spatial sampling based on stratification and they will be an important guide for the future”, says the professor.
The infection risk maps are the result of a stochastic simulation model that takes into account the reported infection rates by municipality, the spatial patterns of the contamination, and the attached uncertainty, resulting from the noise/uncertainty related to the dimension of each municipality population. “The infection rates reported for municipalities with small population are more uncertain than the equivalent rates of large population municipalities”, explains the CERENA researcher.
At this moment, the models are essentially related to the population by municipality, but the research team is already working to add other variables that may be relevant to better assess the effective risk of contamination, for example, mobility or socio-economic conditions. “Técnico, through CERENA and ITI-LARSYS, has just signed a protocol with NOS that will allow the use of mobility data”, says professor Maria João Pereira.
The team involved in this study is composed of professor Maria João Pereira, Amílcar Soares, Manuel Ribeiro and Leonardo Azevedo. “CERENA is being involved in several projects on Environmental Epidemiology so it was easy for us to carry out this study”, says the Técnico professor.
According to professor Maria João Pereira, the potential of this study is “the amount of management achievements that can be extracted from the daily risk maps, which will help to explain this phenomenon”. The CERENA researcher also stresses the importance of these maps in the future, as they will help to analyse everything that has been happening throughout the pandemic in terms of space. “Finally, these models can be used in other countries”, says the Técnico professor. The CERENA team is also preparing infection risk maps of COVID-19 for Azores and Madeira.
“Our maps must be analysed as a whole, in order to exploit their full potential”. “Uncertainty is part of the data and the models, and that is why there is always a risk in decision making. Decision makers are aware of the risk, but rarely use model uncertainty in the decision process”, says the CERENA researcher.
According to professor Maria João Pereira “these maps are an excellent instrument for managing this pandemic. In a process such as this, where the collaboration of the population is crucial to help control the situation, these maps can be useful to help the population to understand what is happening and how the pandemic is evolving, without stoking panic but also without hiding the true”.
As of this Monday, April 6, the maps show that there is already high infection rates around Porto, which have been gradually increasing in the last few days, affecting several municipalities. A gradual increase is also noted in the northeastern region (Trás-os-Montes). A higher risk area started to appear near Coimbra and Pombal, but still of medium extension, while in the rest of mainland Portugal the risk remains low to moderate.